

02 / SELECTED WORK

Engineering stories,
not just project names.

Three systems that show how I move from a real constraint to a dependable, observable result.

FEATURED COLLECTION

Cloud operations: lessons that connect

CDN, monitoring, virtualization and AWS. Four stories about making systems work better.

Explore the collection ↗
CASE 02

FULL-STACK · DATA VISUALIZATION · MOBILE UX

63sessions tracked

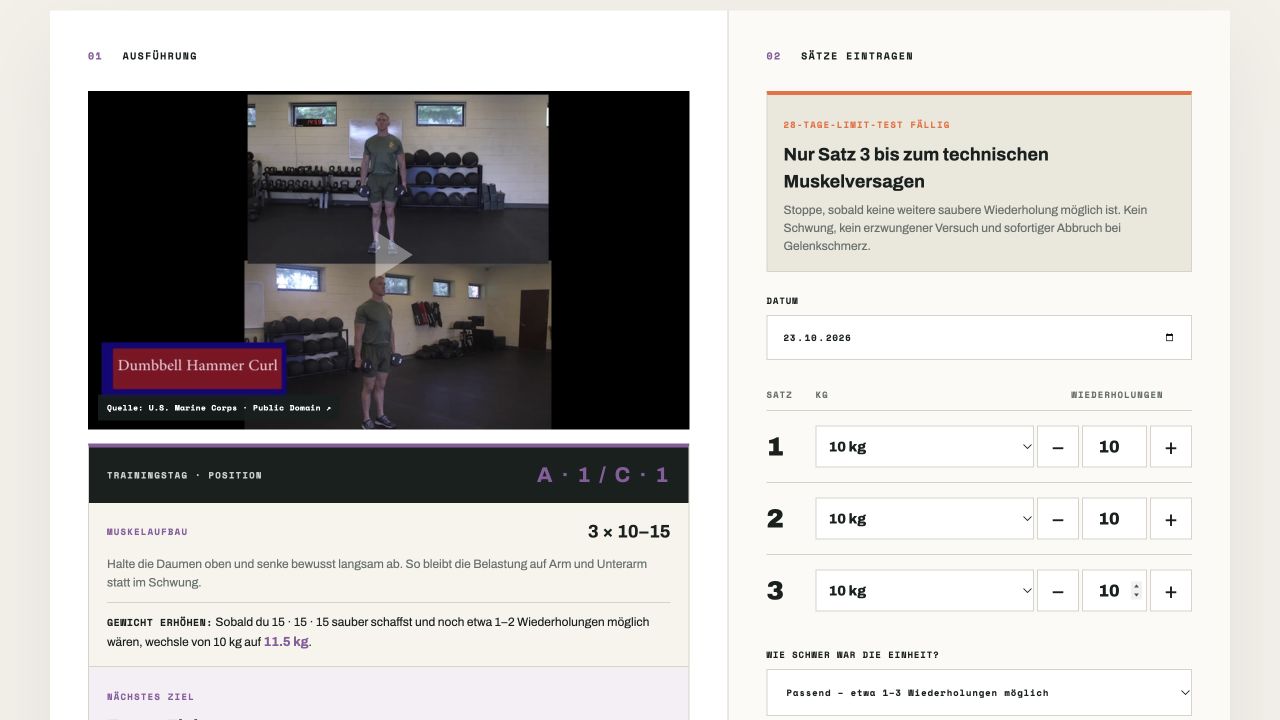
I built Kraftwerk, an app for entering training data: exercises, weights and repetitions for each set. It combines workout logging with a history and progress analysis.

Challenge

Bring fragmented session, volume, and activity data into one trustworthy history without slowing down workout logging.

Approach

Use validated records, import workflows, adaptive plans, and selectable daily, weekly, and monthly chart ranges.

Outcome

A mobile-first training view with persistent sessions, clear volume progress, steps data, and long-range trends.

Read the case study

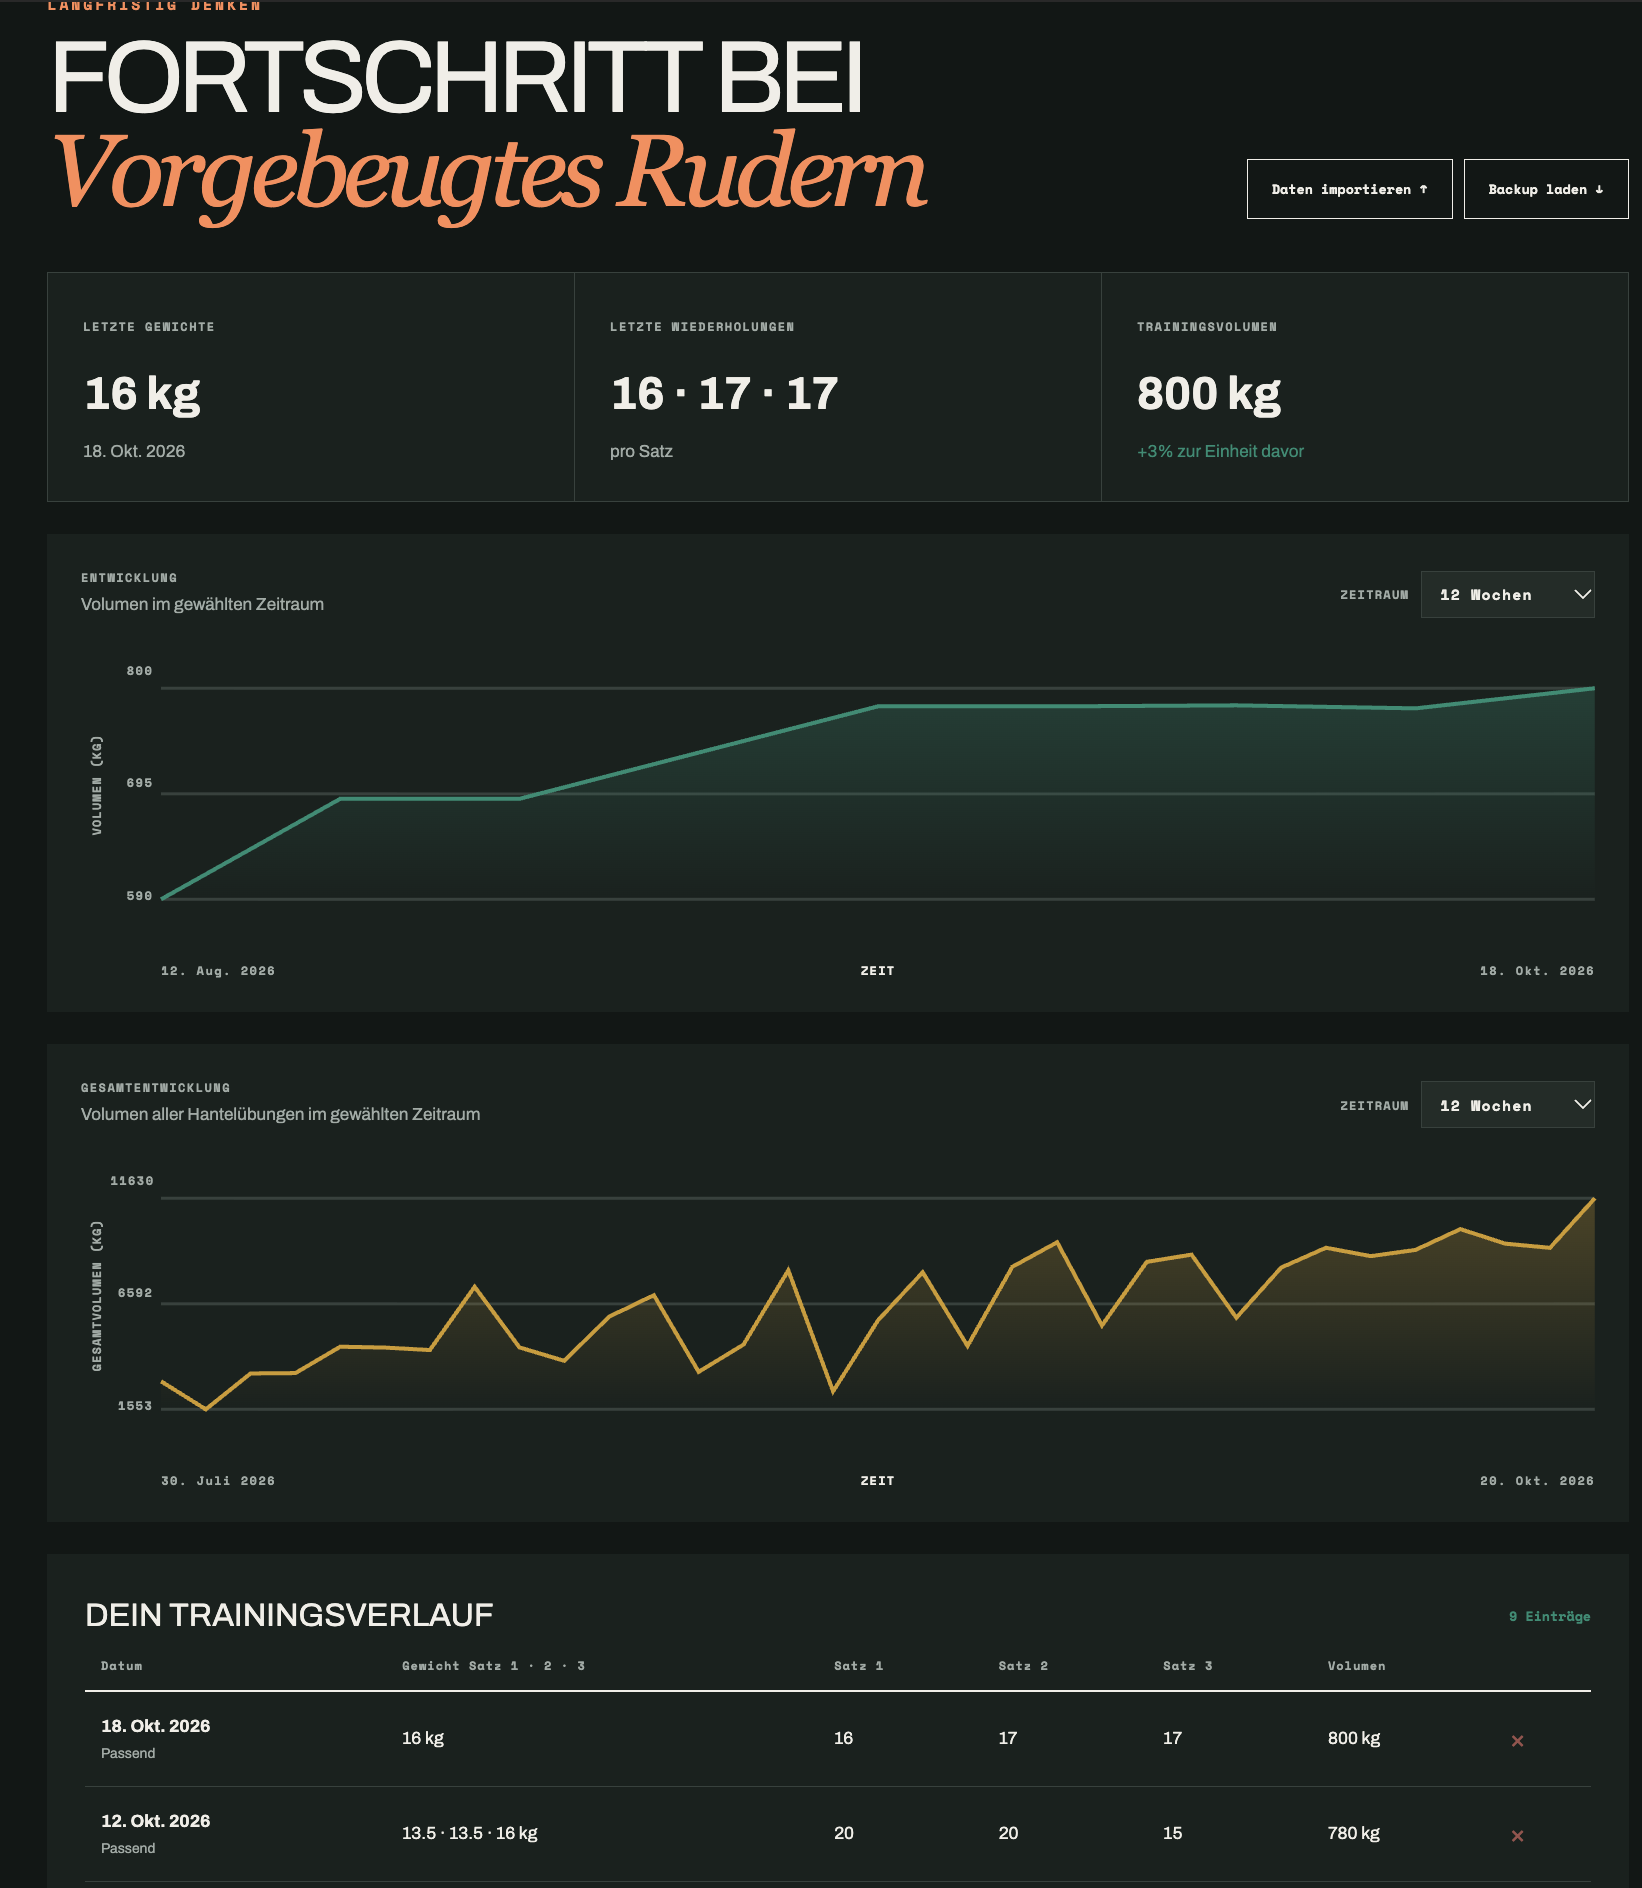
The app I programmed. Choose an exercise and enter the training date, weights and repetitions for each set directly in the app. The saved sessions form the basis for its history, volume calculations and progress charts. The public Kraftwerk page is a read-only presentation of this training history. Read how Kraftwerk began →

Data with context. Session metrics, total volume, steps, and time-range controls make individual workouts meaningful within weekly and monthly patterns.

Built to evolve. CSV and health-data imports keep historical information portable, while the presentation layer can gain new metrics without rewriting the underlying records.

KRAFTWERK / MISSION LOG

From paper to progress.

Four stops in the story of an app built around my own training.

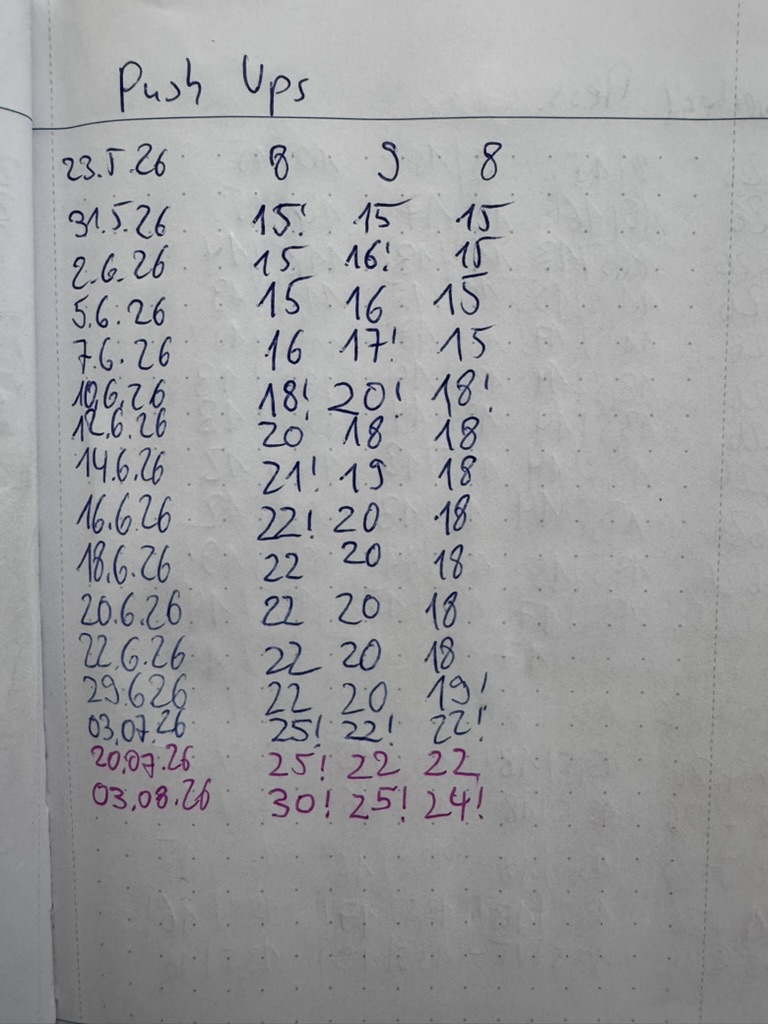
My original push-up notes.
Stop 1 / 4
It started with a notebook.

I could not find the right training app. So I wrote down dates and repetitions by hand. This is my original push-up page.

  • Responsive UI
  • Validated APIs
  • CSV import
  • Health data
  • Interactive charts
CASE 03

OBSERVABILITY · OPERATIONS · AUTOMATION

24/7on-call responder team

When I joined in 2000, a handful of servers and log-analysis scripts were enough to describe the starting point—not a monitoring system that could keep up with growing complexity.

Challenge

Replace reactive log analysis with monitoring that could grow with the infrastructure and flag trouble before users reported it.

Approach

Start with Nagios and Zabbix, introduce service checks and notifications, and retain performance metrics for trend analysis.

Outcome

An evolving monitoring practice, later complemented by Grafana and Checkmk, combining early warning with longer-term operational visibility.

Read the case study

A small setup with a growing blind spot. At the beginning there were only a handful of servers and scripts analyzing log files. As the platform grew, that approach could not keep up with either scale or complexity. More importantly, it was reactive: it told us what had already happened.

The boss and the customer are not monitoring tools. Why wait until a problem has happened to notice it? If a manager or a customer is the first to report an outage, operations is already behind. Beyond the incident itself, that puts confidence in the team at risk—inside and outside the organization.

The classic example: an expiring TLS certificate. In 2000, the certificate-renewal automation familiar today was not available in the same form. Let’s Encrypt arrived much later, in 2015. We needed to monitor approaching expiry rather than discover it through a broken connection. Certificate requirements and issuers can vary; even an automated renewal process needs to be monitored.

Detect, notify and keep the evidence. Our first choices were Nagios and Zabbix. We needed checks that detected problems and notifications that reached someone able to act. Notifications went especially to the 24/7 on-call responder team, so incidents could be acted on around the clock. At that time, cost constraints meant the website did not yet have a high-availability architecture. Reliable detection and rapid response were therefore central to maintaining the best possible service quality; monitoring did not itself remove the risk of downtime. Over the years, delivery channels included SMS, WhatsApp and PagerDuty; these were later developments, not a claim that all of them were used in 2000.

From incidents to trends. Recording performance metrics made it possible to look beyond a single alarm: how were load, latency and available capacity developing over time? Grafana and Checkmk later joined the toolset. The goal remained the same: identify deterioration earlier and use the data to understand where the system was heading.

The principle that stayed. Monitoring is not just a collection of dashboards. It should give the team a chance to act before someone else has to tell them there is a problem.

Historical reference: Let’s Encrypt’s first public certificate announcement (2015).

  • Nagios
  • Zabbix
  • Grafana
  • Checkmk
ADDITIONAL IMPACT
01 / PERFORMANCE · 2008

Taking static delivery off the web servers

Introduced Akamai CDN to cache around 90% of our objects close to users, easing pressure on a bare-metal origin farm.

~90% objects cached near users
Read the project story

The starting point

In 2008, the platform ran on bare-metal web servers behind a single load balancer. There was no caching layer: requests for static content went straight to the web-server farm. As a weather-service provider, we faced extreme swings in demand. Depending on the weather and other major events, individual days brought around 20 times the usual traffic—comparable in scale-up to a retailer’s Black Friday surge. We needed a system that could scale with those peaks.

The bottleneck

At high request rates, available socket capacity became a bottleneck. The website could become unresponsive even though much of the demand was for content that did not need to be served repeatedly by the origin.

The change

With Akamai, around 90% of our objects could be cached close to users. Only about 10% of requests still reached the origin—roughly 90% request offload. That relief allowed us to shrink the web-server farm.

More room to operate

We also gained another way to manage busy days: extending cache lifetimes for suitable content could reduce origin load further. That meant choosing where a longer cached lifetime was acceptable rather than applying one setting to everything.

The lesson: serve repeatable content closer to users, and treat cache policy as an operational lever—not just a performance setting. Historical project summary; infrastructure identifiers and internal operating details are intentionally omitted.

02 / MODERNIZATION

From bare metal to VMware

A storage project that could not meet its original latency requirements became a successful virtualization platform—and a turning point in how I thought about infrastructure.

> €10,000 monthly rack-cost savings
Read the project story

A project I am especially proud of

As a systems administrator, I could change configurations and architecture, but I could not patch away every hardware limitation. We had bought a storage system to provide a cache layer between the web servers and the production systems.

The proof of concept was not the whole picture

The system passed our proof of concept. Under real operational load, however, its latency was too high for the intended role. A project with an investment of several hundred thousand euros was at risk. Did we have to accept failure and write off that investment?

A different use for the same investment

We changed direction. Rather than abandon the storage, we used it as the foundation for virtualizing our bare-metal servers with VMware. The original cache-layer plan did not work out, but the hardware still had value in a different architecture.

A setback became a measurable success

The result was a successful virtualization project. Consolidating the physical servers also saved us more than €10,000 per month in rack costs. We had turned an investment at risk into a platform with a clear operational and financial benefit.

Why this led me toward AWS

Even though the outcome was a success, the experience left me wanting more: infrastructure I could create and change dynamically, much like software. That desire stayed with me. It helps explain why I eventually lost my heart to AWS.

03 / CREATIVE CODING

Browser Arcade

How much Deutsche Mark did I spend on these games as a child? I have no idea. Today, I can build my own browser versions with Codex.

2 playable browser games
Read the story

A small experiment

I wanted to find out whether Codex could recreate the feel of a game in the browser from a few screenshots and some information. That curiosity became Browser Arcade: my own takes on Snake and Galaga.

From pocket money to making things

I do not know how many Deutsche Mark disappeared into these games when I was a child. Back then, I paid to play. Today, I can help bring a version to life myself—and that still makes me smile.

The fun is in trying it

The result is two playable browser games, made for the joy of experimenting. A childhood memory became something I could build, change and share.

Snake ↗ · Galaga ↗